It is the 18th of March, and I’m getting ready for an exciting event: the annual meeting of the VVSOR. This is a conference in which statisticians and operations researchers discuss their current work. To prepare for the conference I make some tea, I get a banana from the fruit bowl, and I say goodbye to my boyfriend. Then I walk all the way to my desk to start up the conference on my laptop.
The covid-19 pandemic has changed our lives considerably the last 1,5 years. Therefore, the theme of the annual meeting is ‘Going viral: modelling the spread’. Today’s speakers are Nelly Litvak, Gavin Shaddick, Dimitris Bertsimas and Jacco Wallinga. Each of them uses mathematics to model the pandemic, but they all add their own point of view to the problem.
Mathematical modelling in epidemiology
In epidemiology, the R-number of reproduction number is widely used. This number shows how many people each infected person infects. It shows the current seriousness of the pandemic and has been widely used by the media.
Less well known is compartmental modelling. In compartmental modelling the spread of a disease is modelled by dividing the population into subgroups and tracking how many people are in each group. The SIR model, developed in 1927, was one of the first models that did this. This model included Susceptible (S), Infected (I) and Recovered (R) groups. A susceptible person can get infected and switch groups (from S to I), and then recover and again switch groups (from I to R). The SIR model is nowadays often extended with an E of exposed, to the SEIR model. Compartmental models can be used for simulations, in which an imaginary population is used to see what the effects are from changes in the model, for example a lockdown that restricts the number of people that are infected by each sick person.
Nelly Litvak: spatial modelling
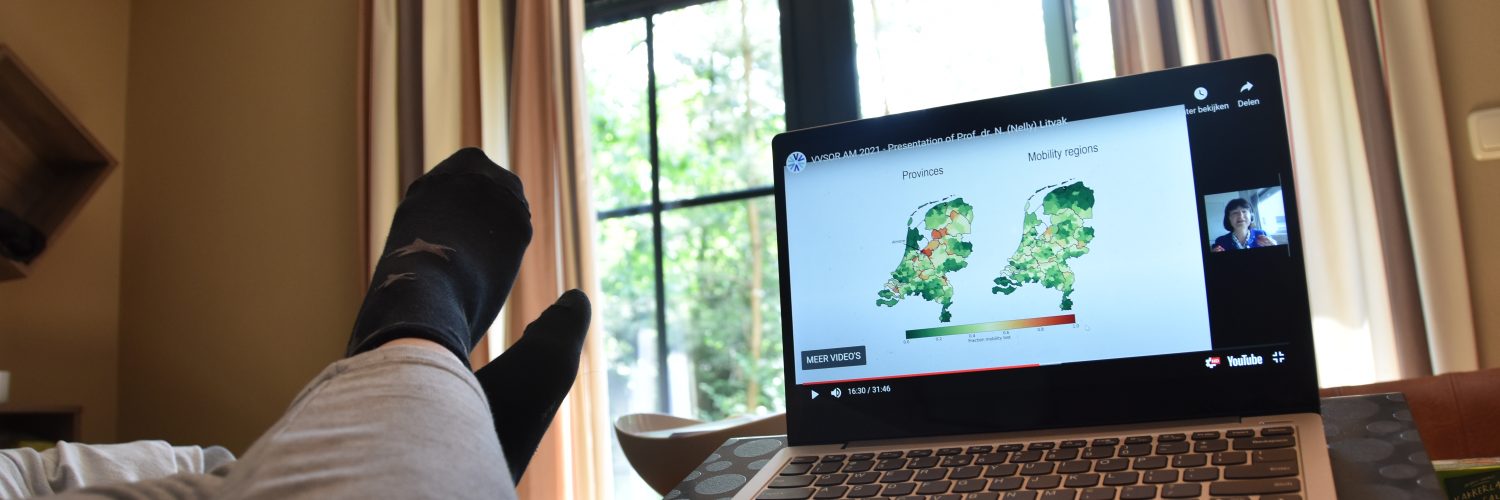
Talking first is Nelly Litvak, professor at both the University of Twente and Eindhoven University of Technology. She models the effect of human movement through the Netherlands on the spread of COVID-19. This is done by using mobility data of the Netherlands: the number of trips from municipality A to municipality B. Professor Litvak then introduces a thought experiment. “Based on the mobility data we can divide the country into regions. If we talk about it very black and white, mobility within the regions is allowed, mobility between regions is not allowed.”
With their thought experiment, Litvak and colleagues would like to know whether such policies can help to contain spreading of infections. Through simulations it is then calculated which regions to choose, which will simultaneously make it possible for people to go to work, but also minimize the spread of the coronavirus. To model the spread of the virus within each region, an elaborate form of the SEIR model is used: the SEI2R2 model, which divides the infected and recovered groups into registered and unregistered.
Professor Litvak also discusses other ways of using the mobility regions. “Our next idea is that we use both mobility and number of infections to decide on the regions.” This way of deciding on regions to take is also called using ‘adaptive mobility regions’. When using simulations to see the difference between mobility regions and adaptive mobility regions, we can see that a lot depends on the amount of concentration of the spread of COVID-19. “Adaptive mobility regions do much better in concentrated scenarios, much more mobility is allowed while infection level is basically the same. But when spread is uniform, geography doesn’t matter anymore, it only matters how much mobility is allowed.”
Gavin Shaddick: microsimulations
Not only in the Netherlands, but also in the UK scientists are busy with finding optimal ways to reduce the spread of COVID-19 while also not destroying the economy. Gavin Shaddick from the University of Exeter studies the influence of time budgets in England on the spread of the disease. “We want to have an idea where people spend their time, and what they do in those different locations”, Shaddick says. These time budgets determine where people have the most risk of getting infected.
The model that professor Shaddick and colleagues built has three steps: hazard allocation, exposure allocation and disease estimation. When someone potentially infected goes to for example the supermarket, they introduce a hazard in that place. Likewise, if someone else goes to that same supermarket, they are exposed to the hazard and have a risk of getting infected. These two components, hazard and exposure allocation, are used for the disease estimation with an elaborate SEIR model. In this SEIR model not only the number of individuals that are infected are used, but also the hazard and expose each person experiences in their daily lives. The model therefore focusses on the individual level, which is also called a microsimulation. The SEIR model also divides infected people into pre-symptomatic, symptomatic and asymptomatic individuals.
Professor Shaddick and co-workers built a model from the spread of the COVID-19 virus through England. Using this model gives the possibility to look at the effects of a lockdown if it was implemented one week earlier than it actually was. This gives a result that is not quite surprising: lockdown a week earlier could have prevented many deaths.
Dimitris Bertsimas: The DELPHI-model
That COVID-19 has created many research opportunities is shown by professor Dimitris Bertsimas of the Sloan School of Management at MIT in Massachusetts, USA. Together with co-workers he created the research groupCOVID Analytics (see https://www.covidanalytics.io/), which aim to quickly develop tools to help combat the spread of COVID-19. The main mathematical method that was developed by this group is DELPHI: differential equations lead to predictions for hospitalisations and infections. Differential equations model the change in a system through time, for example in an SEIR model. This SEIR model used by DELPHI is a lot more complicated than the base model: instead of four different groups, it uses eleven. Next to susceptible and exposed, the infected are divided into six groups. First into undetected, detected hospitalised and detected quarantined, and then each group into people that recovered and people that died.
The DELPHI model is very policy driven, which helps with the decision making of governments. It can simulate what happens when all movement is restricted during a lockdown, or for example when schools are still open, workplaces are still accessible or mass gatherings are still allowed. The effects of these scenarios help the government to decide which measures are best to take during the pandemic. On top of these benefits, COVID Analytics has also helped to determine where vaccines should be tested. To see the effectivity of COVID vaccines, the virus needs to be spreading quickly, otherwise no influence of the vaccines can be seen. Therefore, COVID Analytics determined that the highest spread of disease was in Africa, which helped develop the Johnson & Johnson vaccine.
Jacco Wallinga: at the front lines
Even though it is very nice to see how mathematicians model the spread of COVID and the effects of policies, even more interesting is to see what happens at the front lines in the Netherlands. Professor Jacco Wallinga of Leiden University and the RIVM experiences quite some pressure, standing at the frontlines of the battle against COVID. “Since January 2020 we’ve found ourselves in the spotlight”, Wallinga says.
A lot of the work done by professor Wallinga is recording the characteristics of this specific disease: the transmissibility of the disease, the time it takes to infect someone else and also the incubation period before someone becomes sick. An important factor in this process is the disease burden, measured in Disability Infected Life Years or DALY: how sick get people from COVID and how long do these effects last? “We can see that disease burden is very high among the oldest age groups”, Wallinga tells “This is why we are so concerned about this epidemic.”
Professor Wallinga also shows the current spread through the population, where it becomes apparent that people of 20-24 years old get infected the most, and children of 0-15 years old have the most contact with other people. The number of contacts within each age group, and with other age groups, is modelled again in an SEIR model. “There are three different things we do with these models”, Wallinga explains. “We make projections into the future, we can calculate what would have happened if we had done things otherwise and we explore our possibilities for the future”.
Different points of view
These four researchers all study the battle against the pandemic in their own way. Right now, people are being vaccinated and the world is slowly opening up again. Professor Litvak says that she isn’t doing her research to help with battling the current pandemic, but rather for future ones. “At the beginning of this infection some of this information would have been very useful, but we had no information”, she explains. “There are still a lot of questions, so we continue doing this”.
But doing this kind of research and preventing future pandemics is not always an easy task, as is explained by professor Jacco Wallinga. The data presented to the public needs to be as up to date as possible, and communication has to happen quickly. But there are also other stakeholders involved, who may insist on confidentiality, and the privacy of the studied people also needs to be considered. All these parties have to be taken into account, which results in unrealistic expectations.
From behind my desk, I have learned a lot from this conference. As a statistics student I already knew some mathematics, but I had never seen the way mathematics are used in epidemiology. More importantly, I have learned what it is like to be a researcher in these hectic times. I think these people are doing important work and we should be thankful that they are trying to help stop the pandemic, and prevent future ones. Let’s just hope, for now, that next time at the annual meeting I won’t be able to follow it in my sweatpants anymore.
Photo credits
Main image: Laura Verbeek.


Add comment