
 Carolien de Kovel
What do you want to know from your data? As a statistical consultant, I ask this question very often. Not only of researchers in observational studies with large databases, but also of researchers who have a neatly designed experiment. It turns out this is not an easily answered question. Let’s see an example.
The researchers I was talking to wanted to know how water and nitrogen influence the yield of potatoes, and if this differs between different cultivars, such as Lady Christl or Avamond. They carried out an experiment with different levels of water and nitrogen and many different cultivars. It was a nice, fully factorial experiment. This means they tested every combination.
At the end of the growing season, the potatoes were harvested and weighed and a weight per m2 was calculated for each water-nitrogen-cultivar combination. The proper ANOVA analysis was done, and it turned out that the three-way interaction was significant. This means: The effect of nitrogen on mean yield depends on the water level, but how exactly differs between cultivars.
Ask A.I.
Okay, that is interesting, but it does not yet tell them how one thing depends on the other. So, with a little help of AI, they performed post-hoc tests across all combinations (Figure 1). Now they had results that told them if for example the mean yield of water level 1 – nitrogen level 3 – Lady Christl could be shown to be different from the mean yield of water level 2 – nitrogen level 1 – Avamond. Then they came to me, because how to make sense of this endless number of comparisons? And that is when I asked this question: “What do you want to know from your data?”
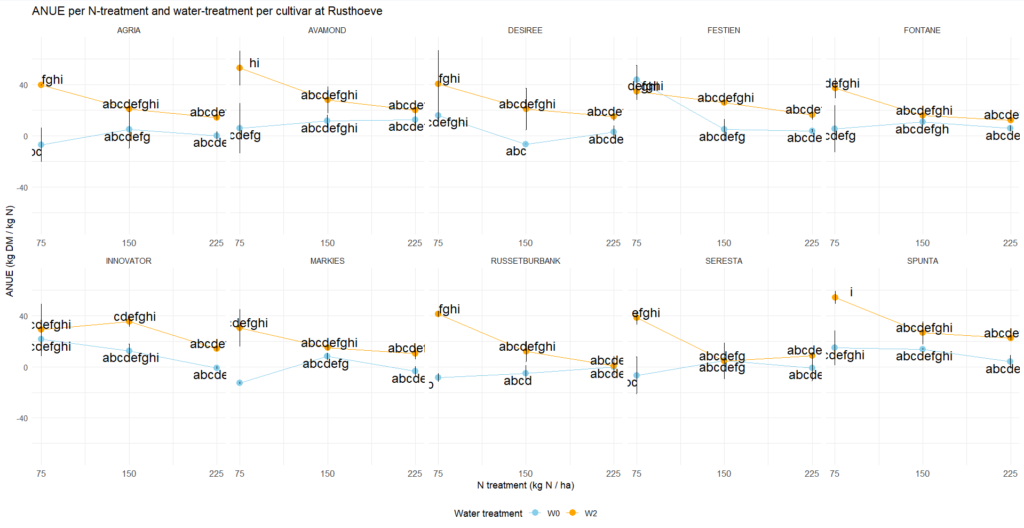
Figure 1. Mean trait values per cultivar at two different water treatments (colours) and three different nitrogen treatments (x-axis). Means with the same letters cannot be shown (alpha=0.05) to be significantly different. Note: original data are modified for the blog.
Hundreds of comparisons do not give us a meaningful answer. What does? For that, we should go back to the research question: how do water and nitrogen influence the yield of potatoes, and does this differ between cultivars? But why did you want to know that? Is it just a fundamental question or are you looking for specific cultivars that are resistant to drought, or that have a constant yield independent of conditions? What is meaningful depends on context.
What questions can be tested?
ANOVA analyses and follow-up in this design can answer questions such as: ‘are means different’ (main effects) and ‘are differences between means different’ (interaction effects). A general research question should therefore be translated into testable hypotheses about differences of means.
Because three-way interactions are difficult to wrap our heads around, we can make things easier and split the data up by for example water level, and average across cultivars. Now we may see for example that at water level 1, average yield across cultivars is not significantly influenced by nitrogen level, whereas at water level 2, average yield increases with increasing nitrogen levels.
But if the researchers are interested in cultivars, we must get more detailed information about those. One option is to check per water level if the difference in yield between two nitrogen levels is significantly larger for some cultivars than for other cultivars.
Depending on the research, data can be split or averaged in different ways. There may be some difficulties with power and multiple testing correction, possibly creating some extra Type II errors, but that is not a main problem. The most important thing is that researchers know what they want to know from their data.
Getting answers about potatoes
Eventually, after quite some thinking and talking, the researchers wanted to know differences in mean yield between the cultivars, averaged across the treatments, a simple main effect.
Next, they decided to test for differences between the cultivars in response to nitrogen, split up per water level, a two-way interaction. They looked at which cultivars did not respond significantly to nitrogen at all, which cultivars had improved yield with increasing nitrogen and how much, and which had declining yield at the highest nitrogen level (nitrogen poisoning).
But for some of the insights they were looking for, it turned out it was more helpful to combine the ANOVA analysis with AMMI and GGE plots (Figure 2). This was an approach they had not thought of at the beginning of the study.
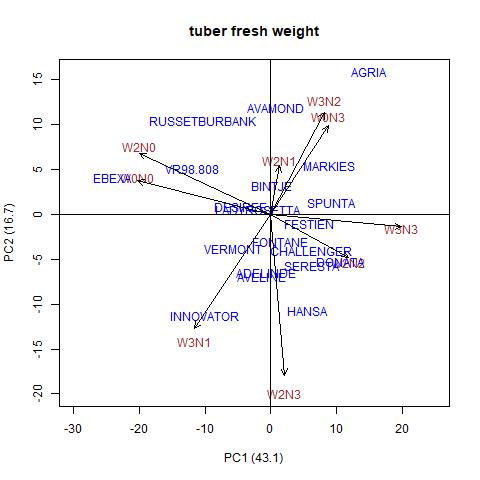
Figure 2: Example of an AMMI plot from publication by Derbew et al. (References)
In conclusion
Whenever researchers come with a plan for an experiment – so preferably before they collect data –, I try to persuade them to write out their research question into testable hypotheses that can have answers that are meaningful for their research. And that is not an easy task, not even in experimental studies. While A.I. may help in performing the analysis, it is the researchers who must do the hard thinking.
Note: the story has been adapted for this blog.
References
– For a more extensive discussion of the use of A.I. in applied statistical analysis, see this paper, in particular sections 5 and 6.
J. Min, X. Song, S. Zheng, C. B. King, X. Deng, and Y. Hong, “ Applied Statistics in the Era of Artificial Intelligence: A Review and Vision,” Applied Stochastic Models in Business and Industry 42, no. 2 (2026): e70075, https://doi.org/10.1002/asmb.70075.
– For a demonstration of analysis with AMMI-plots, see
Derbew, S., Mekbib, F., Lakew, B., Bekele, A., & Bishaw, Z. (2024). AMMI and GGE biplot analysis for barley genotype yield performance and stability under multi environment condition in southern Ethiopia. Agrosystems, Geosciences & Environment, 7, e20565. https://doi.org/10.1002/agg2.20565
Feature image: Potatoes (Photo by Toper Domingo via Pixnio)


 Elia Gonzato

 Mark van de Wiel


 Bernard Zweers
 Miriam Loois
 Simone Griffioen

Add comment