Did you know raising pigeons could be an extremely valuable investment? The most expensive racing pigeon sold last year (in 2020) brought up 1.6 million dollars. The pigeon’s achievements in races mostly determine their value. Since the pigeons all have a different finish line, and the pigeon with the highest average speed currently wins the competition, this calculation might not be completely fair. A speed correction method for the speed loss over larger distances could potentially help to overcome this issue.
Having the possibility to earn a lot of money, next to great passion and fanaticism, causes the current competitions for pigeon racing to be approached by the pigeon fanciers* as a real sport. Cases of cheating, moving the pigeons and the whole family to more ideal racing locations in the country and even doping are not uncommon in the sport. The data of these races can help us showing first indications of cases of unfair competition or cheating. The data used in the calculations for this blogpost are specific for pigeon speed modeling in the Netherlands.
The races
A national race works as follows. All pigeons are picked up at a central location of each local department. They are put into vans and brought to the starting point of the race. The distance of the races differs, the pigeons can participate in longer and shorter flights. At the starting time of the race, all pigeons are freed from the vans at the same time and they all fly back home to the house of their pigeon fancier. This means some pigeons fly further than others. The pigeons are trained and find their homes by using the earth magnetic field, position of the sun and other cool features to navigate back.
Statistics
In some national flights there are up to 30.000 participating pigeons. All fly back to their own homes, and bridged distances may therefore fluctuate a lot (sometimes a 300km difference). The winning pigeon is the one pigeon who has, on average, flown the fastest during the rage. In the data we look at the highest average speed per minute. As you may imagine, the pigeons who must fly less distance have an advantage. In the figure below, you can see data of a national flight with its starting place in Chateauroux (France). Each dot represents a pigeon in the race, and their speed is plotted at the location of their home. The blue-red colors show the average speed of the pigeons distributed over the country. The pigeons in the south have on average, higher average speed. The numbers indicate the top-10 of pigeons in this race result.
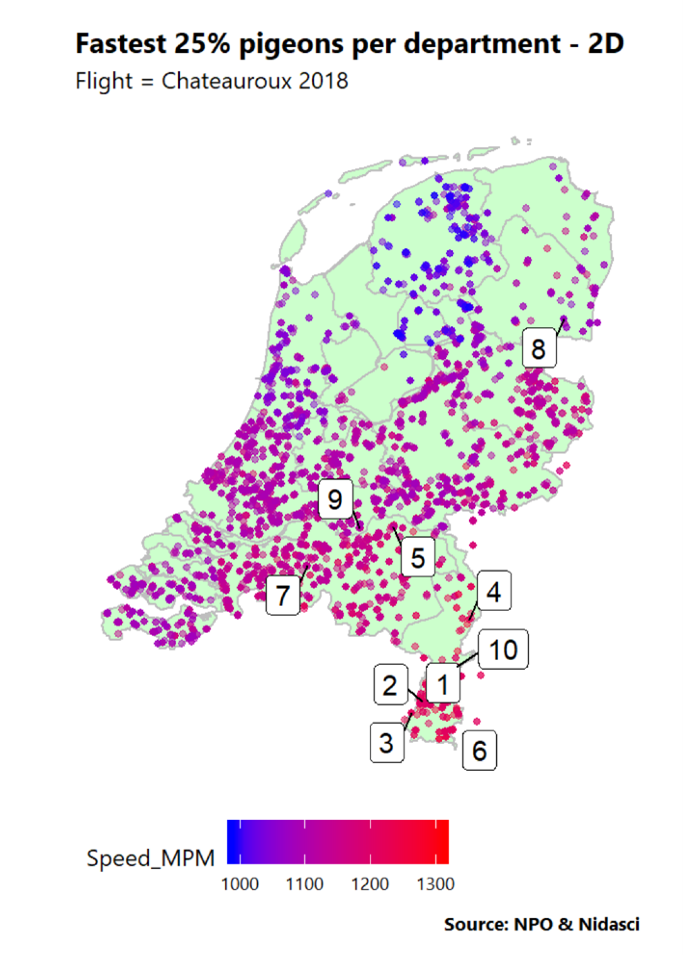
Outliers
In some races, there are one or more pigeons who have a very unlikely average speed, either extremely fast or slow. Awfully slow pigeons have possibly navigated wrongly or took a siesta. Fast pigeons can either be talented or could, for instance, have accidentally escaped from the van on the way to the starting point. Or the fanciers may have cheated with the chip used for registration. In the current system there is no objective way to indicate that the achievement of a pigeon is unlikely or impossible. Therefore, the pigeon with the highest average speed will win the race and the price money.
Speed correction
After having analyzed many flights, we (researcher Rudo Reiling of the scientific committee of the Dutch Pigeon organization (NPO) and I) have noticed a recurring pattern. The pigeons who fly smaller distances reach higher average speeds per minute. Another factor involved is the direction of the wind. If the direction is, for example, more favorable for the pigeons with their homes in the West of the country, the top-10 pigeons will be more skewed into that direction. One of the assumptions we also make is that the pigeons all over the country are – in general – equally talented.
The SNEL** method uses the data of all pigeons in a race itself to correct for speed loss because of distance and wind effects. It uses a linear regression model with the coordinates of the finish location of the pigeon as input, to correct for the location effects. After fitting this regression model, we use the residuals to indicate the new winners after correction. We see in the figure below, that the new winners are then more evenly spread over the country and the one pigeon ‘8’ in the previous figure, has now become the winner of the whole race:
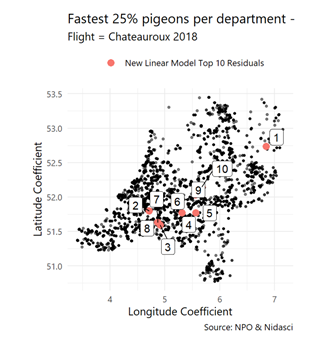
Another advantage of this SNEL regression model, is that unlikely results can be detected as well based on the data of each flight. This would make it possible to perform outlier detection supported by data.
Fairer results
After analyzing the data of many pigeon races, it could be said that using speed corrections could make the results and valuation of pigeons fairer. The first step towards more fairness could be to acknowledge the location advantages of certain areas and to perform more research and calculations to find appropriate and robust speed corrections. I was first approached by Rudo Reiling of the Dutch Pigeon Organization (NPO) to work on the statistics for this speed-calculation project about 7 years ago. At that time, I had no idea about the fascinating world and serious training and attitude of the pigeon fanciers. Now I can safely say I am also a pigeon race fan!
Notes
* Pigeon fanciers are people who raise pigeons.
**SNEL = Systematische Neutralisatie Effecten Ligging
Main image: Burtamus on Pixabay


Add comment