Statistics is not like most other branches of mathematics. You don’t get clear, crisp results, but always something like probabilities or likelihoods on which you then have to base your conclusions. It is more than most other kinds of mathematics connected to the ‘real world’, which is also fuzzy.
The cookbook of statistics
Performing statistics is, except maybe for the most basic cases, not like following a recipe in a cookbook. It is much more like real cooking. You have to deal with missing ingredients or ingredients of less than optimal quality. You often have multiple choices of which ingredients to include and multiple choices of how to prepare them: for example, do you parboil or sauté your vegetables before further use or not. You have to decide how to arrive at the best possible dish. And there is usually a part taste or habit in that. Often, there is no such thing as a perfect dish. Because you shouldn’t just follow a recipe, you must understand -to some extent- what you are doing.
Is the value 3.5% a likely mean of the population?
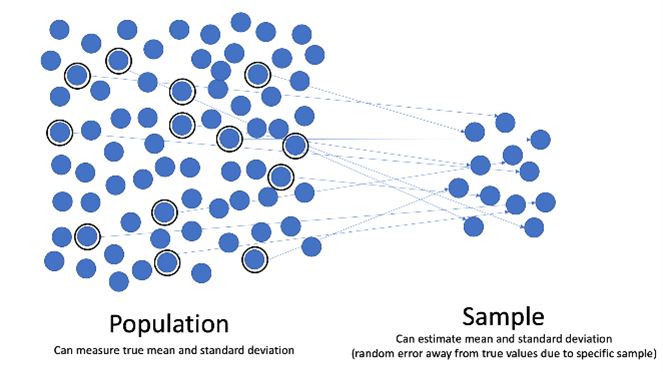
An important part of statistics classes are the hypothesis tests. Usually we are interested in a very large group of elements, such as all schoolchildren in the Netherlands or all Holstein Friesian cows in France. This group of all something is the population we are interested in, but usually it is not feasible to study each and every cow. Therefore we take a subset, a sample. This sample we study, hoping the results are valid for the whole population. However, any sample is likely to deviate somewhat from the population, just by chance. Hypothesis testing starts with a hypothesis about the population, e.g. that the average fat percentage in the milk of those Holstein Friesian cows is 3.5%. This is your hypothesis maybe because that would be optimal for some industrial process. Now the scientific method is to try to find evidence that this hypothesis is wrong, while at the same time giving it the benefit of the doubt. Suppose in the sample, the average fat percentage is 3.4%. Now statistical procedures can tell you whether it is probable that this is just some deviation because the sample is by chance a bit different from the population, so the value 3.5% gets the benefit of the doubt. Or it is very unlikely that this happens by chance, and you reject the hypothesis of 3.5%. Conclusion: the population probably has a mean fat percentage below 3.5%.
Trying different recipes
So, can’t you just apply a recipe to tell us, yes 3.5% is not unlikely (p-value > 0.05) or it is unlikely (p-value < 0.05). No, even for this fairly simple situation you have to cook. You may have to consider outliers: a cow with a fat percentage of only 0.5%. What to do with that? And the simplest statistical procedure for this situation requires a normal distribution of the data. If we doubt the normal distribution of our variable, we can transform the fat percentages and take for example the logarithm of each value. If a transformation does not help to get a normal distribution, we can choose a different test, such as Wilcoxon’s signed rank test on the median rather than the t-test on the mean. Note that doubting the normality of the distribution is already a grey situation. Doubt is not black and white.
The more ingredients, the more choices. Do you use a variable (e.g. plant height) as a quantitative thing, transformed or not, or do you bin the values into groups of e.g. 10-20 cm, 20-30 cm etc. And if you make groups, how many? Do you correct for environmental conditions when looking at the mean? Maybe the outside temperature influences what you are measuring or counting. If so, you may want to make a statistical model that includes temperature. In a different blog, I talk about choosing the ingredients. Every time you add or change an ingredient, you have to think again about the interpretation at the end. And all the time you must keep checking if assumptions are met, and if choices make sense. It happens that there are multiple reasonable approaches, possibly none of them perfect. Then taste and habit start playing a role. Make sure that, unlike maybe in your real cooking, you write down exactly what recipe you used.
In class, your choices are often restricted, for example by the limited number of approaches you already have been taught or by the way the data are provided. But if you learn to cook, you also often start with following a recipe.
Credits
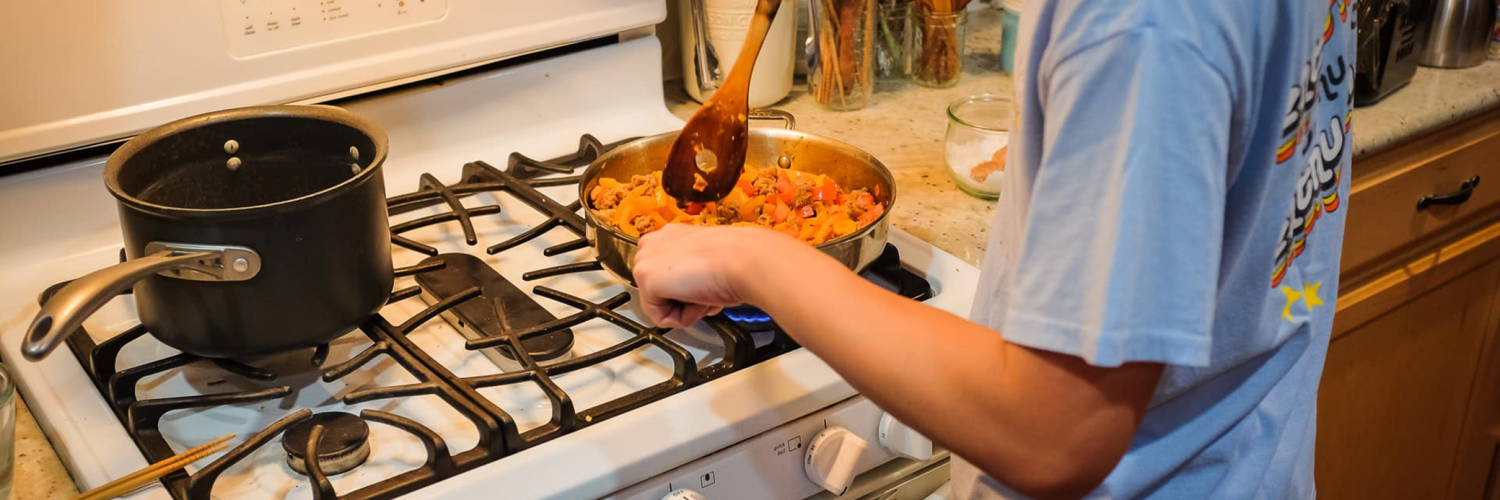
Main photo: This Photo by Unknown Author is licensed under CC BY-SA


Add comment